Send the exact assignment or rubric from your classroom and a custom sample written to it lands in 24 to 48 hours, the first one free. BUS-FPX1050 is Capella’s Principles of Microeconomics course. It centers on using marginal reasoning, elasticity and market structure to explain one decision, with the numbers shown and checkable. Searches like "bus fpx 1050 assessment 3 assignment example", "BUSFPX1050 sample paper", and "BUS-FPX1050 assessment samples" land on this page.
What BUS-FPX1050 is really about
Most courses in the business core are scored on the quality of an argument. BUS-FPX1050 is partly scored on whether an answer is right, and that changes how the work has to be done. An elasticity computed from the wrong pair of numbers, a total divided where a marginal figure was asked for, a shortage predicted above the equilibrium price: a scorer finds those in seconds and no amount of clean writing repairs them. The habit the course exists to install is marginal thinking, which is the difference between what something costs on average and what the next unit costs. A large share of wrong answers in the early assessments come from reasoning about the average when the question was about the next one.
Opportunity cost is the second habit and the one students most often report in a sentence that names nothing. The cost of a choice is the specific alternative it displaced, so a paper saying that an hour of study costs an hour of paid work is doing the job, and a paper saying that resources are scarce is not. Figures are the third. A demand and supply diagram is a claim about direction and size, and the assessments expect the prose to state which curve moved, why, and what became of price and quantity as a result. Because this course sits early in the program, presentation criteria read labeling, units and captions closely, and a well drawn graph with no caption still loses marks.
What BUS-FPX1050’s assessments ask for
Assessments generally hand you a market, a firm or a policy and ask you to analyze it with the tools from the course. That means identifying what is being decided, computing what the instructions require, and explaining the result in ordinary language. Where elasticity appears, a coefficient on its own earns little; the criteria are reading the interpretation after it, what a value above or below one implies for revenue if the seller raises price. Market structure questions want the number of sellers, the barriers and the pricing power that follows, applied to a named industry. Where a price floor, a ceiling or a tax appears, expect to be asked who ends up carrying it, which is rarely the party the policy names.
Where students lose points in BUS-FPX1050
The costliest errors here are simply wrong, and they arrive in a small number of shapes: marginal and average confused, elasticity computed without the percentage change, a shortage and a surplus labeled backwards, a curve shifted where only a movement along it was warranted. After the arithmetic, marks go for a concept defined and then used on nothing, for opportunity cost written as a general remark about scarcity, and for graphs that appear with no axes labeled and no sentence telling a reader what to look at. Points also go for conclusions that outrun the model, recommending a policy on grounds the analysis never established, and for reference slips, which criteria in a first economics course read attentively.
The BUS-FPX1050 drawers
BUS-FPX1050 Assessment 1 marginal analysis example
Assessment 1 typically works one decision at the margin with the calculation shown. On request, free, 24-48h.
BUS-FPX1050 Assessment 2 elasticity problem set example
Assessment 2 often asks what a price change does to revenue and quantity. On request, free, 24-48h.
BUS-FPX1050 Assessment 3 competition analysis example
Assessment 3 usually places one industry among the four structures and argues its pricing power. On request, free, 24-48h.
Your classroom shows something else?
Capella University revises courses; assessment counts and deliverables shift between terms. Send what your classroom shows and the desk matches it exactly.
Using a BUS-FPX1050 sample the right way
Work a sample with a pencil. Redo each calculation as you meet it, because the arithmetic is exactly the part your own scorer can verify and the part a passive read never fixes. Then watch how the writer moves from a number to a sentence, since interpretation is where the remaining marks sit and most submissions stop at the result. Check each figure against the paragraph beside it: the two should be making one claim, and where they disagree the sample will show you which was written first. Then run your own numbers against your own instructions.
How these samples are written
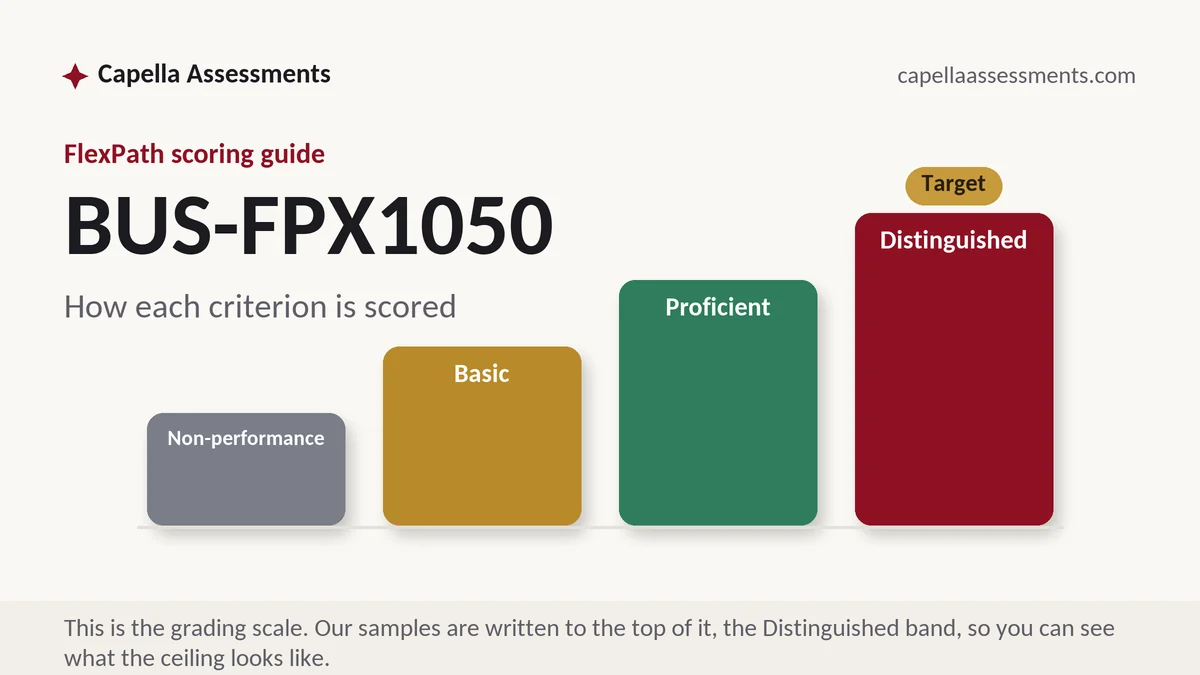
Samples here follow one discipline: the scoring guide is the outline, every criterion gets its section, the Distinguished description decides the depth, and the APA layer ships exact. Because Capella updates courses over time, your free custom sample is drafted against the scoring guide you send, not against an archive.
BUS-FPX1050 questions, answered
Do I have to show every calculation?
Show enough that a reader could reproduce the result: the formula, the numbers you put into it and the answer with its units. Early criteria award presentation as well as accuracy, so labeled working beats a figure asserted mid sentence. It also limits the damage of a slip, since a visible step costs one line where a hidden one costs the whole question.
What if my answer is not what I expected?
Check the base you divided by and the direction of the change before rewriting the paragraph. Most surprises in this course come from using a total where a marginal figure belonged, or from reversing a percentage change. Where the result still looks odd after checking, say so and name the condition under which it would hold, which reads as command rather than doubt.
Can I read a BUS-FPX1050 example before I attempt mine?
Yes, and it is the quickest way to see how much interpretation each answer needs. Attach the instructions and the criteria your courseroom published, and the first sample is free, usually back within 24-48h. Study how the calculation and the explanation are laid out together, then work your own figures, since the numbers in your version will be different.